Firebug — an open source web development tool extension for the Mozilla Firefox web browser — is incredibly powerful, with a wide range of super useful and practical features that would benefit any web designer or developer.
In fact, this browser extension (also available in other web browsers with limited functionality) is so useful and popular that it has browser extensions of its own.
This real-time coding tool reduces the guesswork out of debugging web pages, among many other things such web page layout inspection/testing and web performance profiling, to speed up your workflow.

Whether you’re building a web page, adding new CSS for a responsive web design, troubleshooting web layout issues, or inspecting how other websites are built, Firebug is going to be a valuable tool in your arsenal.
Let’s take a closer look at how this indispensable browser extension can help web designers. We’ll only focus on certain Firebug functionalities that are especially helpful for web designers.
Getting Started with Firebug
First, you’ll need to download and install Mozilla Firefox if you don’t already have it.
Then you also need to download and install Firebug.
Once you’ve got the extension installed, you’re ready to start dissecting any website.
You can experiment with how it works just by playing around with it or you can take some time to read the official Firebug documentation (which is a wiki).
Opening the Firebug Panel
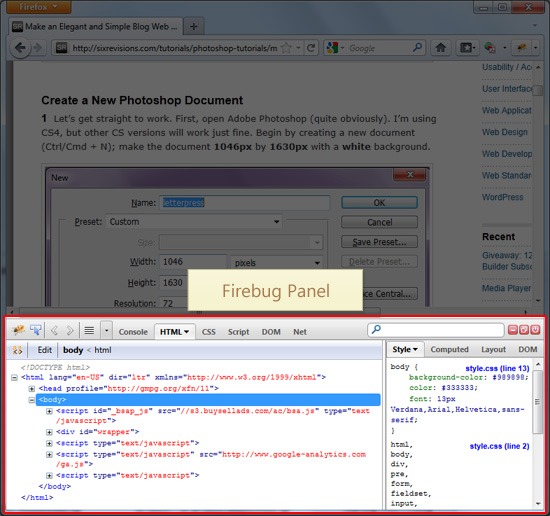
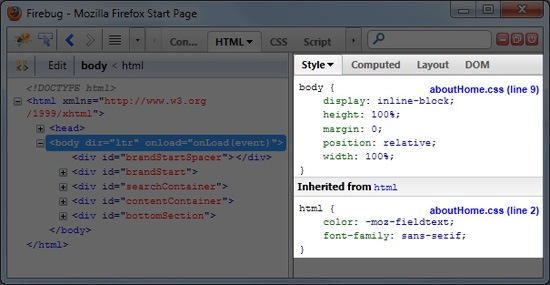
There are several ways to open the Firebug panel. When it’s open, it should look like the image below.
Opening Firebug Using a Keyboard Shortcut
Press F12, which is the keyboard shortcut to toggle Firebug on and off (see other Firebug keyboard shortcuts).
Opening Firebug in the Browser’s Context Menu
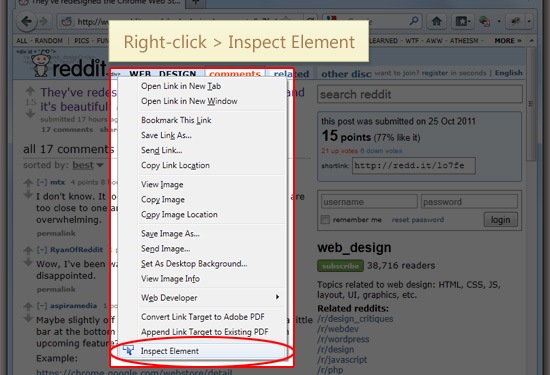
On any web page, right-click on the page or a particular HTML element (such as a hyperlink, a text heading, an image, a form button, etc.) and then choose Inspect Element from the context menu that appears.
Firebug Icon
You can also click on the Firebug icon to open the Firebug panel. Depending on your version of Firefox, it will be in the bottom status bar, or in the upper chrome to the right of the search bar.
![]()
Tip: Have Firebug in Its Own Window
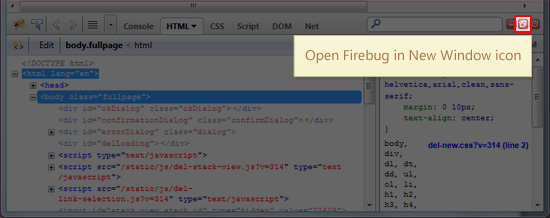
Once you have Firebug open, feel free to break it out of the browser and into its own window by pressing the Open Firebug in New Window icon. This is perfect for big monitors or for multi-monitor computer set-ups.
Now you’re ready to do some damage. Next, we will talk about some useful Firebug features and techniques.
Inspecting a Web Page’s Layout and Markup
It’s the most common question you’ll ask about a web page you’re developing: "Where’s the flaw?" (or "WTF" for short). The most common use of Firebug is inspection.
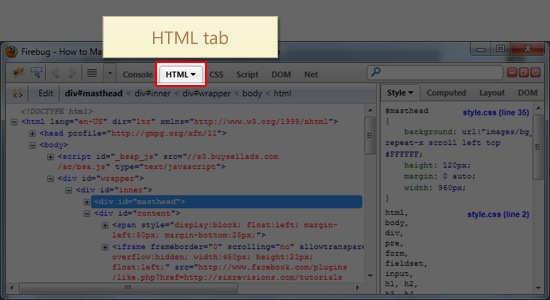
Once Firebug is open, you’ll be in the HTML panel by default. This is the panel that will help you inspect and understand the web page’s HTML elements.
There are two panes in the HTML panel. Let’s briefly discuss these panes.
Node View Pane
Firstly, on the left, is the Node View pane displaying the generated source of the page you are currently on.
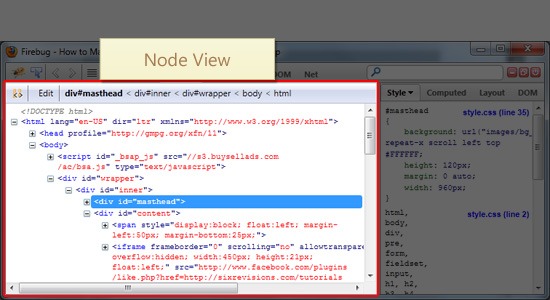
Node View allows you to edit HTML elements/code on the web page and then see the result on the fly.
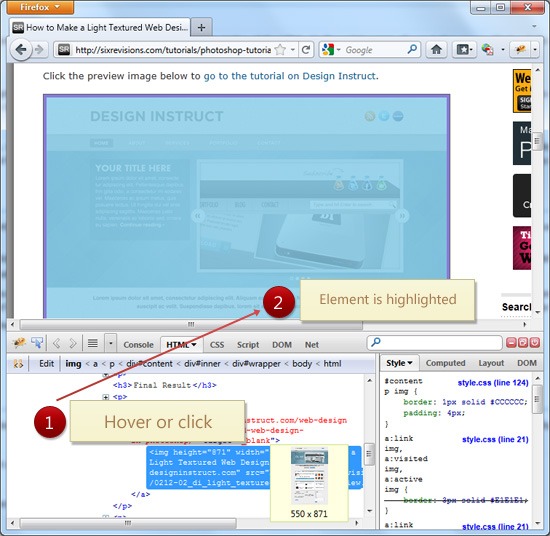
When you mouse over the HTML markup in Node View, the browser actually highlights the element on the web page being inspected. This is incredibly helpful functionality – it shows you exactly how the browser is handling your HTML elements and where that particular element is on the actual web page. This can help you visualize margin/padding issues and float problems, for example.
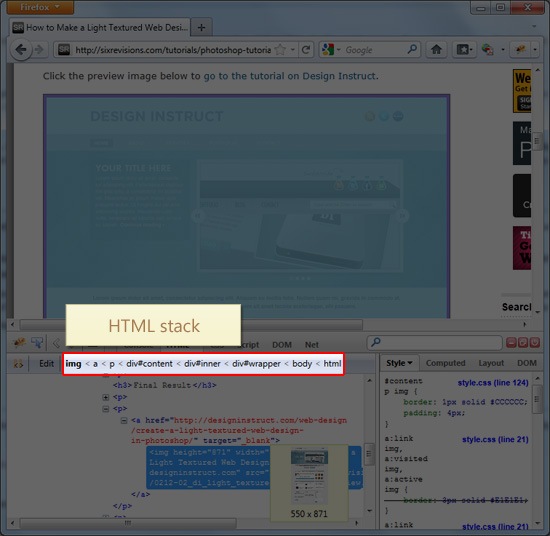
When you click on an HTML element in Node View, it will show the element stacking order just above the pane. This is helpful for any CSS you have to write that needs to be more specific to prevent styling similar elements elsewhere on your site. More often than not, I’m inspecting to see what CSS rules are being inherited.
To help you quickly find HTML elements, try the search feature towards the right of the HTML panel, which will, in Node View, highlight the matched text in gray.
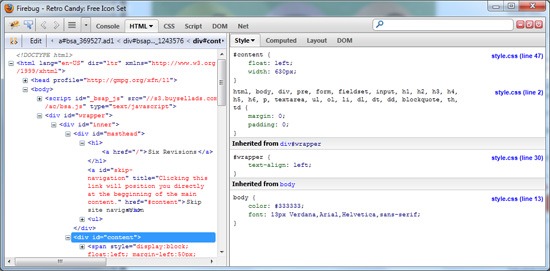
HTML Side Panels
The second pane, on the right, is the Side Panels. These panels give you more information on the highlighted element.
There are four side panels in the HTML panel.
- Style
- Computed
- Layout
- DOM (which stands for document object model)
The Style side panel shows you what CSS style declarations affects a particular element. It also displays which style sheet (and what line number) the style rule is in, in case you have more than one stylesheet.
The Computed side panel displays CSS properties of the HTML element such as font-size, color, text-align etc. This gives you information on how the web browser renders the element.

The Layout side panel visually shows you the box model of the element you’ve clicked on. If you’re a visual learner like me, it’s really nice to see the padding, border and margin illustrated like this. Double-clicking on the displayed values allows you to make changes and experiment in real-time.

The DOM side panel displays the document object model information of the selected element. It’s especially useful for front-end web developers working with JavaScript/client-side scripting.
Edit HTML on the Fly
There are a hundred different ways to manage your HTML workflow when you have access to files on the server or when you’re working in a local server environment using a web server stack like XAMPP or WampServer. I think most people prefer to work right in their own code editor, so code can be saved as you go whenever they can.
However, for quick in-browser tests and situations where you don’t have access to the HTML files (such as a website you don’t own or when you’re away from your dev computer), Firebug is perfect.
In Node View of the HTML panel, you can click on any HTML element and edit it. Add or remove whatever you like and then see what results your changes make to the web page.
A few common tasks I perform in this way include:
- Adding/removing entire HTML elements (e.g. "What happens to the floats if I remove this
div?") - Adding/removing a class or ID to elements (e.g. "Will the rendering issue get fixed if I remove this CSS class?")
- Substituting longer text on titles and buttons to test line breaks
- Adding temporary inline styles for quick testing using the
styleHTML property (e.g. "Will this hyperlink look better withstyle="color:#00aeef"orstyle="color:# 067fad"?")
Firebug doesn’t save any code you write in it; when you click a link or refresh the page, your changes are gone. (And you wouldn’t want it any other way!) So, it’s a good idea to keep a text editor handy for pasting in code you’ve tried or may want to keep.
Editing CSS on the Fly
Editing CSS within Firebug is where the real action is, at least for web designers. As has been mentioned, inspecting an HTML element on the page will reveal its inherited styles in the Node View of the HTML panel. These styles are listed alphabetically, and grouped by selector on Style side panel.
The selectors are presented in the rendered CSS order: the most recent declaration at the top (for example, something at the beginning of the style sheet will be at the bottom of the CSS pane, and inline styles would be shown at the top as element.style).
If you use multiple style sheets, it does the same thing. For example, I’ll often use Eric Meyer’s CSS reset as the first style sheet on a site, so I’ll often see a very long selector at the bottom of my Style side panel.
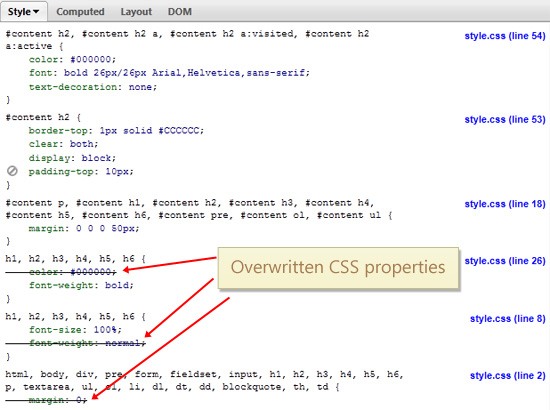
Firebug makes it clear which styles are actively affecting your HTML
element by crossing out the CSS properties that have been superseded by
another CSS property declaration. If there’s a line through it, then it
means that another CSS rule has overwritten it by being declared after
the former rule, or by being !important.
The great thing about the CSS in the Style side panel is that it’s
editable. Want to see how the web page would look if you changed the
element’s padding-top property to 22px? Click on the property value and change it. You can also change the property itself (e.g. change padding-top to padding-bottom).

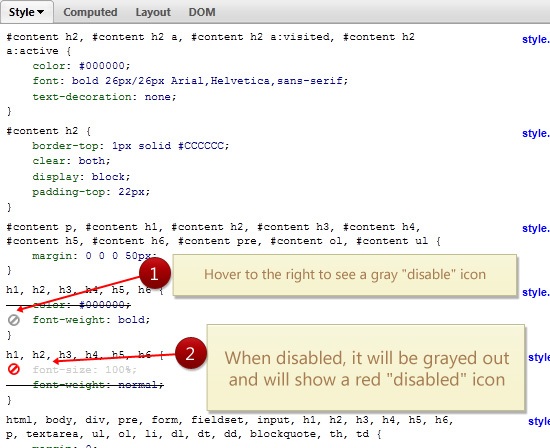
You can also disable/hide a CSS property/value pair to see what the page would look like if it didn’t have that rule. This is useful for seeing unneeded CSS lines in the web page, determining if the property declaration is what’s causing rendering issues, etc.
When you’re editing CSS in the Style side panel, the Enter key will jump to the next editable cell – from property to value, and down to the next property.
When you’re at the last property of the selector, hitting Enter will give you a new line, where you can add a new CSS property/value pair.
Now if you want to add CSS to an element that doesn’t have a class or ID (and therefore won’t appear in the Style side panel), you can either add inline styles in Node View, or venture into the CSS panel.
The CSS panel shows you a page-view of the various style sheets you’ll have attached to the site.
In Source Edit mode, you are able to edit values (Similar to the HTML panel’s Style side panel we discussed earlier). In Live Edit mode, you can actually type freely as if you were working on your site’s style sheet in a code editor.
 Editing via the CSS panel.
Firebug Quirks and Limitations
Even Firebug has its quirks, but with the insane release schedule Firefox is under lately, who can blame it?
Here are a few issues that cause occasional hiccups when using Firebug for debugging, as well as some limitations you will have when working with it. Let’s just talk about a few of them.
HTML Elements with Hover Properties
It can be hard to troubleshoot elements that have CSS :hover rules or JavaScript hover events, like fly-out drop-down menus
because the Node View updates the markup when you mouse out of the
element. So one issue is that it gets tricky to study nested elements of
the parent element that are hidden until you hover over the parent.
I’ll usually work around this by using the style HTML property to force the element to be visible, which isn’t ideal for a live-test, but gets the job quickly done.
For example, say I want to debug and study the unordered list in the flyout-menu div below. But there’s JavaScript that hides the div when the mouse isn’t on the element.
<div class="flyout-menu">
  <ul>
    <li>Menu item one</li>
    <li>Menu item two</li>
    <li>Menu item three</li>
  </ul></div>
I can just add, for example — because it depends on how the div was hidden but basically you want to counteract the JavaScript DOM manipulation — the following inline style to the div.
<div class="flyout-menu" style="display:block;">
  <ul>
    <li>Menu item one</li>
    <li>Menu item two</li>
    <li>Menu item three</li>
  </ul></div>
For more solutions to this issue, read this Stack Overflow question and answer thread.
Firebug CSS Panel Bugs Out Sometimes
Occasionally the CSS panel will be unable to provide you with Edit Mode and then it will throw an error. I can’t pinpoint the cause, but if you’re testing various User Agents, it happens a lot more. A browser restart usually fixes it.
No Code Formatting Options
You don’t really have an option to display and format that code you see in Firebug based on your own preferences/formatting guidelines. So, if you were going to copy CSS or HTML directly into your work, for example, what you see is what you get. However, there are many online CSS formatters you can use after (or during) development.
Firefox is Different from Other Web Browsers
Another interesting "problem" is that Firefox is a pretty great browser! So good, in fact, that it can cause issues when it smartly corrects errors in the markup.
For example, consider the following list item element:
<li><a href="home.htm">Home</li>
Someone has forgotten the closing </a> tag. Some
browsers may render this properly by respecting this error, and have the
link spiral out of control. Firefox, however — and subsequently Firebug
because it relies on Firefox’s layout engine — will show you the </a> in the proper place. (This is called the generated source.)
This essentially means that if you’re having an issue in another browser, Firebug may not give a 100% accurate representation of the same code. This also means that what you see (and fix) in Firefox, may still cause trouble in other browsers because of layout-rendering differences and error-treatment disparities between browsers.
So, Firebug won’t completely save you from having to debug in other browsers. However, Firebug is available for some other browsers besides Firefox: It’s available in a Lite version for browsers such as Google Chrome.
Additionally, Google Chrome, Safari, IE and Opera have similar development tools:
- Google Chrome: check out the built-in Chrome Developer Tools
- Apple Safari: see the WebKit Web Inspector
- Internet Explorer: see the Internet Explorer Developer Tools
- Opera: has the Opera Developer Tools
Get Buggin’!
So that’s a quick look at some of the web-design-related features that Firebug has. Using this tool can greatly improve your debugging and site production process.
Also, let’s face it. This is one of the best tools ever for pranking your friends. "Hey Steve! Come check this out!"
 To be honest, Firebug pranking is how I learned all of this.
via http://sixrevisions.com/tools/firebug-guide-web-designers/


Comment
コメントする